Reporting & analytics
Automated fleet reporting software that turns maintenance data into decisions
Every cost, repair, and meter reading becomes a report you can act on — cost per mile and per engine hour, VMRS component spend, PM compliance, and downtime — updated in real time across your whole fleet.

Cost & spend
See exactly where every maintenance dollar goes
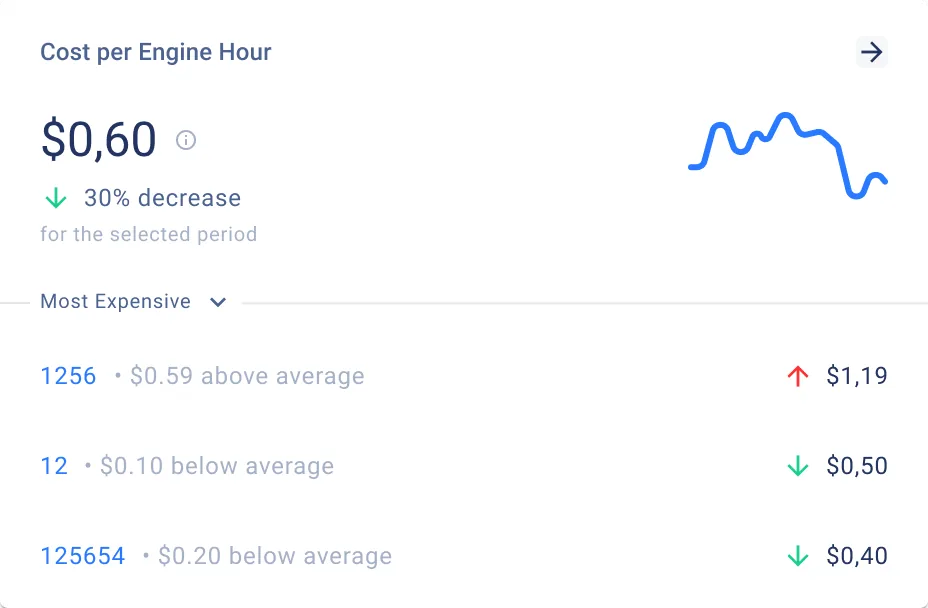
Cost per mile and per engine hour
Know the true operating cost of every unit and spot the outliers — by mileage or per engine hour.
VMRS component cost breakdowns
See spend by system — brakes, tires, engine — across the fleet.
Parts, labor, and service spend
Every work order rolls up into total cost of ownership.
Rank your most expensive assets
Sort units by cost to target repair-or-replace decisions.
Reports built for the decisions you actually make
Cost per mile
Operating cost per unit by mileage.
Cost per engine hour
Operating cost for hour-based assets.
VMRS component reporting
Spend by system — brakes, tires, engine.
PM compliance reports
How reliably preventive service gets done.
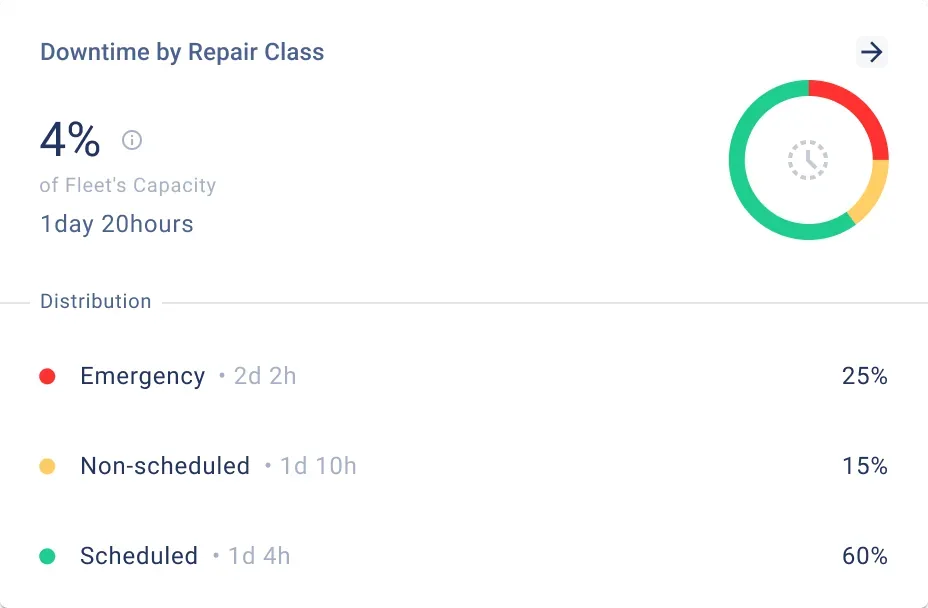
Downtime by repair class
Scheduled vs non-scheduled vs emergency.
Spend breakdown
Parts, labor, services, fees, and tax per job.
Total cost of ownership
Full lifecycle cost per asset.
Most-expensive ranking
Sort units by cost to target decisions.
Uptime & trends
Find the downtime and trends costing you money
Downtime by repair class
See how much downtime is scheduled versus emergency — and attack the emergencies.
PM compliance at a glance
Track how reliably preventive maintenance gets done.
Trends over time
Watch cost and downtime move month over month, not just today's number.
One source of truth
Every cost and repair in one place — no scattered spreadsheets.
Capture. Report. Decide.
Capture
Every work order, fuel entry, and meter reading feeds your data automatically.
Report
Cost, compliance, and downtime reports update in real time.
Decide
Spot the costly units and the emergency-prone repairs, and act.
Trusted by fleets that run on Fleetpal
5.0on G2"Management platform made it simple."
"Fleetpal helped me save money."
"Reporting is amazing!"
"FleetPal Connect helped me see the whole picture."
Explore more of the platform
Work Orders
Create, assign, and track every repair.
Learn morePM Scheduling
Schedule PM by mileage, engine hours, or time.
Learn moreEquipment Management
Run vehicles and heavy equipment on one platform.
Learn moreParts Inventory
Keep parts stocked and tied to work orders.
Learn moreDVIR & Defects
Operator inspections that flow to the shop.
Learn moreFleet reporting software FAQ
What is fleet reporting software?
Fleet reporting software turns maintenance and operating data into reports — cost per mile, PM compliance, downtime, and spend by component — so managers make decisions from facts, not guesses. Fleetpal reports across the whole fleet in real time.
What reports does Fleetpal provide?
Cost per mile and per engine hour, VMRS component cost, PM compliance, downtime by repair class, spend breakdowns, and total cost of ownership per asset.
Can I see cost per mile for each vehicle?
Yes — per unit, by mileage or engine hours, with VMRS component-level breakdowns.
How does reporting help cut costs?
By surfacing the most expensive units and the emergency repairs driving downtime, so you can fix root causes instead of reacting.
Can I track PM compliance?
Yes. PM compliance reporting shows how reliably preventive maintenance is getting done across the fleet.
Do reports update in real time?
Yes — reports reflect work orders, costs, and meter readings as they're logged.
What is automated fleet reporting?
Automated fleet reporting means your reports build themselves from operating data instead of manual spreadsheet work. In Fleetpal, every work order, part, fuel entry, and meter reading feeds reports automatically — odometer and engine-hour readings can sync straight from your telematics provider — so cost per mile, PM compliance, and downtime stay current without compiling anything by hand.
How does Fleetpal provide real-time fleet insights?
Reports reflect the fleet as it runs: the moment a work order closes, a part is used, or a meter reading lands, cost per mile, downtime, and PM compliance update. Managers see which units are trending expensive and which repairs keep turning into emergencies — while there is still time to act.
Does Fleetpal's reporting work for large commercial fleet operations?
Yes. Fleetpal is built for heavy-duty commercial fleets — trucking, construction, utility, government, and waste — and reporting scales with the fleet: rank every unit by cost, break spend down by VMRS system across the whole operation, and filter by asset group from one source of truth.
Can I customize and export Fleetpal's fleet reports?
Yes. Reports can be filtered and customized — by date range, asset group, and more — and exported to spreadsheet (CSV or Excel) so finance and operations teams can work with the data wherever they need it.
Stop guessing. Start reporting.
See how Fleetpal turns your fleet's data into decisions that cut cost and downtime.