How Fleets Actually Use Maintenance Reports (and What Real-Time Fleet Insights Really Mean)
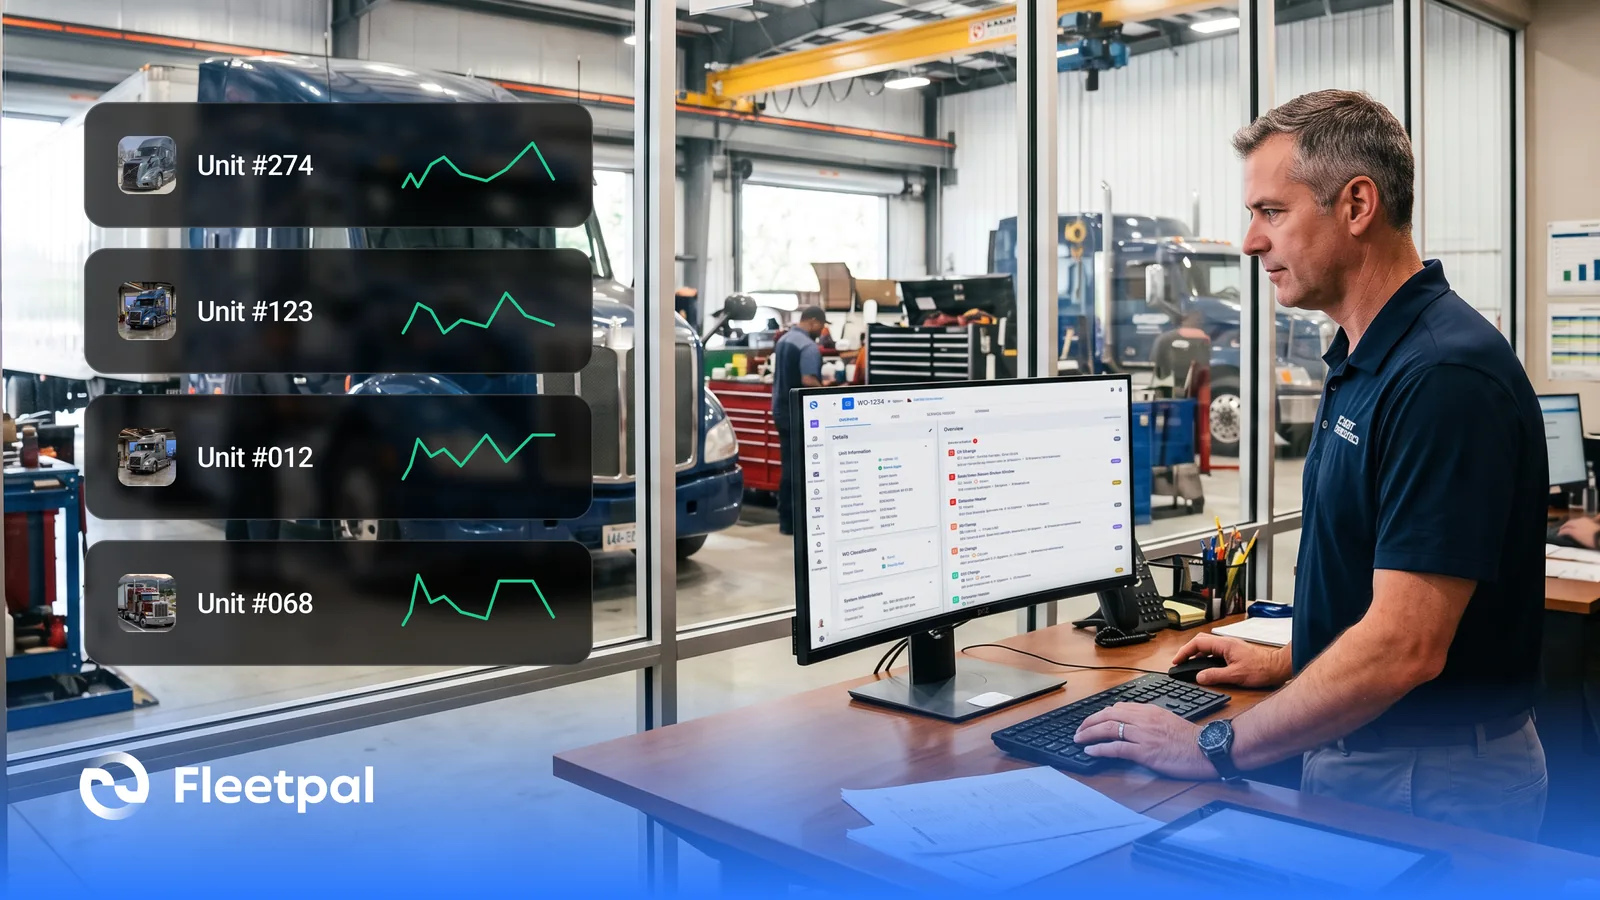
The Monday meeting starts with a question the fleet manager cannot answer: why did maintenance spend jump last quarter? The answer exists. It is spread across closed work orders in one system, vendor invoices in another, and meter readings a dispatcher keys in when she remembers. Somebody spends Tuesday building a spreadsheet, the spreadsheet is a week old by the time it circulates, and the units that caused the jump have already cost another week of money.
That is the reporting problem most fleets actually have. It is not a shortage of data. It is that the data lives too far from the decisions and arrives too late to change them. Here is how fleets that have this under control use their maintenance reports, what real-time fleet insights mean once you strip the marketing off the phrase, what reporting software has to show you to be worth paying for, and what to ask any vendor who says their dashboard will change how you run the shop.
How do fleets actually use maintenance reports?
Fleets that get value from reporting use a small number of reports for a small number of decisions, and they use them on a rhythm. Every week, someone looks at which units are open in the shop and why, and how much of that downtime was planned. Every month, someone ranks the fleet by cost per mile or per engine hour and looks hard at the top of the list. Every quarter, someone compares spend by system, brakes against tires against engine, and asks whether a pattern is a fleet problem, a route problem, or a vendor problem. And whenever a unit comes up for replacement, someone pulls its full cost history and puts it next to the cost of the unit that would replace it.
In Fleetpal, those reports are built into the platform rather than assembled from it: maintenance cost per mile and per engine hour for every unit, a ranking of the most expensive assets, spend broken down by VMRS system across the fleet, PM compliance, downtime split by repair class, and total cost of ownership per asset, all fed by the same work orders, parts, and meter readings the shop already records. The fleet reports page lists the full set, and the fleet management KPI guide covers the formulas behind each number.
What breaks in practice: the fleet has forty reports and uses none of them, because nobody decided which three questions the reports are supposed to answer. Reporting that starts from "what can the system show" produces a wall of charts. Reporting that starts from "what do I decide every Monday" produces a habit.
Ask the vendor: "Show me the report you would open at the start of a Monday, and tell me the decision it is for."
See where your fleet is losing money
Fleetpal brings inspections, work orders, and PM schedules into one system — so downtime stops catching you off guard. Book a 20-minute walkthrough.
Schedule a demoWhat do real-time fleet insights actually mean?
Real-time fleet insights means the report reflects the fleet as it runs, without a compile step in between. When a work order closes, the unit's cost changes. When a part is charged to a job, the job total and the asset's history change. When a meter reading lands, cost per mile recalculates against the new denominator. Nobody exports anything, nobody reconciles anything, and the number you see on Wednesday afternoon is the number as of Wednesday afternoon.
Two things that phrase does not mean. It does not mean you should watch the report all day; a maintenance manager who refreshes a cost dashboard hourly is not managing anything. And it does not mean the data captured itself. Every real-time report has a capture step somewhere underneath it, and that step is the whole game, which the next sections come back to.
In Fleetpal, reports update the moment a work order closes, a part is used, or a meter reading lands, so cost per mile, downtime, and PM compliance are current without anyone compiling them. Odometer and engine-hour readings can sync from a telematics provider on the supported list, which removes the most error-prone manual entry in the chain.
What breaks in practice: a vendor calls a report "real time" when it means the nightly job ran. The difference matters most at the end of a month, when finance wants the number today and the number is from yesterday.
Ask the vendor: "Close a work order in front of me and show me the report change while I watch."
What should fleet reporting software actually show a maintenance manager?
Strip the category down and a maintenance manager needs six views, each tied to a decision. Cost per unit, normalized by miles or engine hours so a tractor and a loader can sit on the same list without lying. A ranking of that list, so the expensive units are at the top and not buried in a table. Spend by system, so you can see whether the money is going to brakes, tires, or engine before you guess. PM compliance, because the fleets with high emergency repair cost are almost always the fleets that skip scheduled service. Downtime by class, because an hour of scheduled downtime and an hour of emergency downtime cost very different amounts. And the trend of each of those over time, because a single month's number tells you almost nothing and the direction tells you almost everything.
Fleetpal covers those six. Every unit carries maintenance cost per mile or per engine hour, depending on how the asset is tracked, and the fleet can be sorted by cost to put repair-or-replace candidates at the top. Spend is broken down by VMRS system. PM compliance shows how reliably scheduled service is actually getting done, and downtime is reported as scheduled, non-scheduled, or emergency. Cost and downtime can be watched month over month, so a manager sees a unit trending expensive rather than discovering it once it has already become the most expensive unit in the fleet.
What breaks in practice: the software reports total cost per unit without normalizing it. The unit that runs the most miles looks the most expensive, the manager considers replacing the hardest-working truck in the fleet, and the truck that is quietly eating money per mile stays in service because its total is small.
Ask the vendor: "Rank my units by cost per mile for the last ninety days, then open the most expensive one and show me where the money went by system."
Can fleet reporting software predict which truck will break down next?
No, and it is worth being direct about this, because prediction is the claim this category likes to make most. A maintenance report is a record of what has already happened, organized so that a person can see it. It can show you that one unit's cost per mile has climbed three months running, that its emergency repairs outnumber its scheduled ones, and that its brake spend is double the fleet average. What it cannot do is tell you the date the next failure lands, because that depends on the route, the driver, the load, the weather, and a dozen things the maintenance system has never seen.
The honest version of the promise is narrower and more useful. Good reporting makes the trend impossible to miss, early enough that a person can act on it. The manager who sees a unit climbing the cost ranking in month two can move its PM up, pull its history, and put a technician on it before month four. The manager who only sees a total at year end cannot. That is the whole difference, and it is a large one, but it is a person deciding, informed by a record, not a system deciding for them.
Fleetpal works this way on purpose. The reports rank units by cost and split downtime by repair class so the trend surfaces, and the decision about what to do with a trending unit stays with the manager who knows the route and the driver. If a vendor tells you their software knows which truck fails next, ask to see the list of predictions it made last year and how many came true.
What breaks in practice: a fleet buys a prediction and stops looking at the report, because the system will supposedly tell them. The trend was in the data for months. Nobody was reading it.
Ask the vendor: "Show me one unit whose cost per mile climbed for three straight months, and show me where in your product I would have noticed in month one."
What should real-time reporting tools for large commercial fleet operations handle?
Scale changes the reporting problem in three ways. The first is volume: a ranking of six hundred units is useless unless it can be cut by group, so the regional manager sees her region and the equipment manager sees the yellow iron. The second is mixed assets: a large operation runs tractors on miles, loaders on engine hours, and trailers on neither, and a report that only understands mileage leaves half the fleet out. The third is audience: at scale the people reading reports are not the people entering data, and the reporting has to work for a finance analyst who has never opened a work order.
Fleetpal handles the three. Reports filter by asset group and by date range, so a large fleet can be read one terminal or one equipment class at a time from a single source of truth. Assets are tracked the way they actually run, on miles or on engine hours, and both appear in the same cost views. And access is set by role, so finance can be given a read-only view that opens every report and changes nothing.
What breaks in practice: the fleet grows past the reporting. The tool that worked for eighty trucks produces one undifferentiated list at four hundred, and the regional managers go back to keeping their own spreadsheets, which is the situation the software was bought to end.
Ask the vendor: "Filter every cost report to one asset group and one quarter, and show me a user who can read all of it and edit none of it."
Can a report be more accurate than the data behind it?
No. This is the unglamorous truth under every "real-time insight" claim: the report is exactly as good as the capture discipline feeding it. Cost per mile is wrong if meter readings are stale. Spend by system is wrong if technicians charge parts to the job without saying which system they went on. Downtime by repair class is wrong if nobody classifies the repair. And the fleet that skips those steps gets a beautiful dashboard of fiction, updated in real time.
The fix is a short list of capture habits, and the software should make each one hard to skip. Meter readings arrive without a human keying them, wherever telematics can supply them. Every part that leaves the shelf is charged to a work order, which is how the cost reaches the unit. Every work order carries the system it touched and whether the job was scheduled, and closes when the work is done, not at the end of the month when someone cleans up. Vendor invoices are entered against the unit they belong to, so outside repair cost does not vanish into an accounts-payable total.
Fleetpal is built around those habits. Odometer and engine-hour readings can sync from Samsara, Motive, Geotab, EROAD, and Coretex. Parts are charged to work orders, and the work order carries the parts, labor, services, fees, and tax that make up its total. Vendor work is recorded against the asset with the same cost structure, so an outside repair shows up in the unit's cost per mile next to the in-house work.
What breaks in practice: the shop closes work orders in a batch on the last day of the month. Every downtime number for the month is wrong, every unit looks healthy until the thirty-first, and the manager who checked the report on the twentieth made a decision on a fleet that did not exist.
Ask the vendor: "Show me what a technician has to fill in before a work order can close, and show me a unit whose last meter reading came from telematics."
How do you get fleet reports to finance without rebuilding them in a spreadsheet?
Finance does not want your dashboard. Finance wants the numbers in the tool finance already uses, cut the way finance cuts them, on the schedule finance runs. The category answer has two halves: reports that can be filtered to the slice finance is asking about, and an export that lands in a spreadsheet without a reformatting step. The failure mode is a maintenance manager retyping report numbers into a workbook every month, which is the spreadsheet problem reintroduced one layer up.
Fleetpal reports can be filtered by date range, asset group, and more, and exported to CSV or Excel, so an analyst gets the quarter's cost by asset group in a file she can work with directly. Combined with a read-only role, finance can also pull its own numbers without waiting on the shop.
What breaks in practice: the export exists but only for the whole fleet, all time. Finance receives a file with every work order since the software was installed and builds a pivot table on top of it every month, and the maintenance manager still gets the call asking what the numbers mean.
Ask the vendor: "Filter cost by asset group for last quarter, export it, and open the file."
What should you ask a fleet reporting software vendor before you buy?
Reporting is rarely the reason a fleet chooses a maintenance platform, and it is often the reason the fleet regrets one, because the reporting only gets tested after the data is in. Run the demo questions in this article on live data, yours if the vendor will load a sample. Then ask the wider questions: how the platform captures work orders and parts in the first place, because that decides whether the reports are true, and how it handles preventive maintenance, because PM compliance is the report that predicts every other cost report. The work order buyer's guide and the evaluation questions for heavy-duty maintenance software cover that ground, and the vehicle downtime guide covers what to do once the downtime report shows you where it hides.
If you want to see the reports in this article on a real fleet, book a demo and bring the ranking question, the ninety-day trend question, and the export question. A vendor who can answer all three in one session has reporting that works. A vendor who wants to schedule a follow-up for the reporting part is telling you something.
The Fleetpal Team
Fleetpal builds maintenance and inspection software for commercial fleets. Our team works with fleet managers, technicians, and safety directors every day, turning shop-floor and roadside data into fewer breakdowns and lower cost per mile.
Ready to cut downtime and cost per mile?
Walk through a live setup with our team and see what your fleet's data has been trying to tell you.
Schedule a demoRelated articles
How Cities and Counties Actually Manage Fleet Maintenance (and What Software Has to Prove)
How city and county fleets manage maintenance across departments: PM on the right meter, approvals before spend, audit trails, and what to ask vendors.
Read article
How to Choose Fleet Maintenance Software for Heavy-Duty Fleets (Without a Best-Of List)
The evaluation questions that separate fleet maintenance software vendors: mixed fleets, telematics data flows, work orders, PM triggers, and cost.
Read article
How Fleets Actually Manage Parts Inventory (and Why the Count Never Matches the Shelf)
How fleet parts inventory management actually works: accurate counts, parts tied to work orders, cost per repair, and what to ask software vendors.
Read article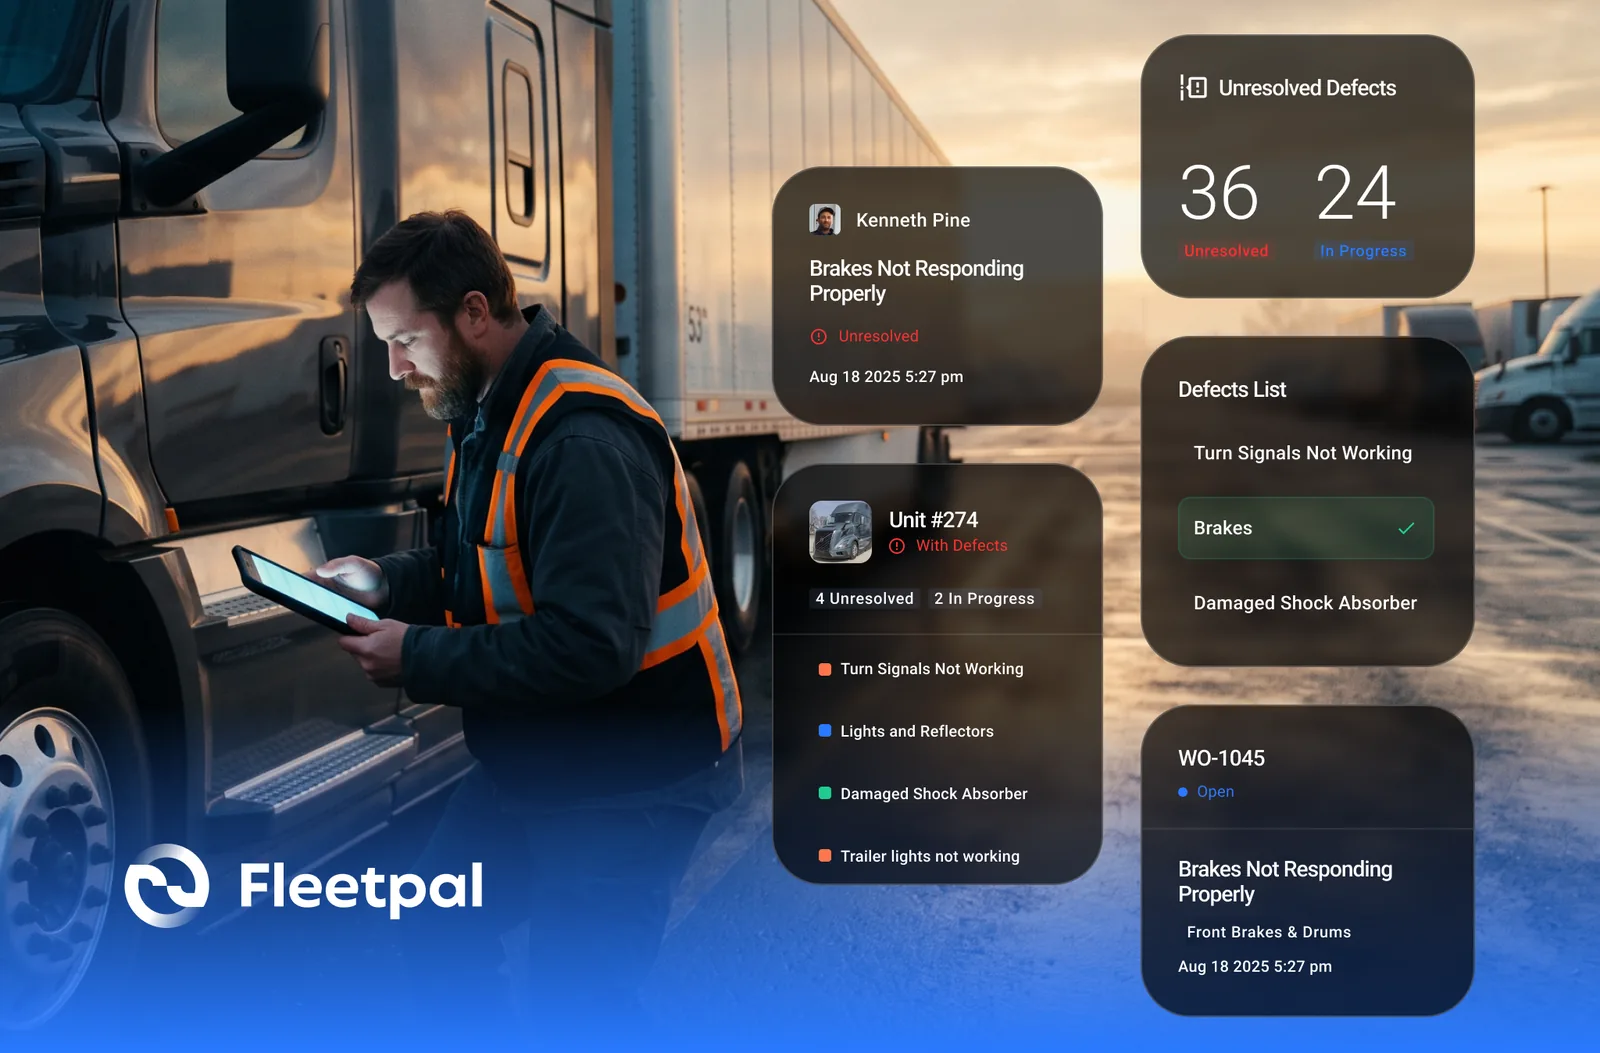
How Failed Inspection Items Become Work Orders (and Why Most Fleets Lose Them in Between)
Converting failed DVIR items into work orders: how the loop should run, where it breaks, and what to ask vendors who integrate inspections and work orders.
Read article
How to Spot an Inflated Repair Estimate Before You Approve It
Five red flags on a vendor repair estimate, how to baseline what a job should cost, and what to ask a vendor who claims to flag overpriced estimates.
Read article